What is a risk management matrix template?
A risk management matrix template is a ready-made grid for scoring risks by how likely they are to happen and how much damage they would cause if they did. Teams rate each risk on a shared scale, then use the result to decide what needs attention first.
Most teams start from a blank spreadsheet every time a new project kicks off. That works until three people rate the same risk three different ways because nobody agreed on what counts as medium. A template fixes that by locking in consistent scoring criteria before anyone starts rating.
Importance and benefits
A risk management matrix template earns its place in a project by doing three things well: giving every risk a consistent score, making priorities visible at a glance, and creating a paper trail that holds up in an audit or client review.
Consistent scoring - Everyone rates likelihood and impact against the same scale, so a risk level doesn't shift depending on who filled in the form
Faster prioritization - A color-coded result surfaces the risks that need attention first, instead of a flat list nobody has ranked
Clearer reporting - A completed matrix gives stakeholders a single view of project risk, rather than a verbal summary in a status meeting
Audit-ready records - A dated, owned matrix is easier to defend in a compliance review than a risk conversation nobody wrote down
What to include in your risk management matrix checklist
A good checklist keeps every entry consistent, so nothing falls through when someone new picks up the matrix.
Risk description - A specific, plain-language statement of what could go wrong and where.
Risk category - Group by type, like safety, operational, financial, or compliance, so patterns are easy to spot later.
Likelihood rating - A consistent scale (one to five, or low/medium/high) showing how probable the risk is.
Impact rating - The same scale applied to how severe the consequences would be if the risk occurred.
Risk score - Likelihood multiplied by impact, or however your scale combines them, so risks can be ranked at a glance.
Existing controls - What's already in place to reduce the risk, and how effective it currently is. This is what turns a basic risk log into a risk control matrix.
Control owner - The person accountable for maintaining or improving the control, not just the team.
Review frequency - How often the control gets checked, tested, or re-assessed.
Residual risk score - The risk level left over after controls are applied, so you can see what still needs attention.
Date and reviewer - A record of when the entry was last updated and by whom, for traceability.
Once these fields are in place, using a risk management matrix template can help track how each risk evolves over time, since the two documents work best when they're updated together rather than in isolation.
How to use a risk management matrix template
A risk management matrix works best when it's used as an active decision-making tool, not a static record. Follow these steps to get the most out of it:
1. List every identified risk. Start by populating the matrix with all relevant risks, drawn from audits, incident reports, team input, or industry checklists. Keep descriptions specific rather than generic ("forklift collision in Warehouse B" rather than "workplace accident").
2. Score likelihood and impact. For each risk, rate how likely it is to occur and how severe the consequences would be if it did, using a consistent scale (e.g., 1–5 for both). This is what plots each risk onto the matrix grid.
3. Plot and prioritize. Use the resulting position on the matrix, low to high risk, to prioritize which risks need immediate action versus ongoing monitoring. High-likelihood, high-impact risks should move to the top of your action list.
4. Assign controls and owners. For each risk, document the existing or planned control, who owns it, and how often it's reviewed or tested. This turns the matrix from a risk list into an accountability tool.
5. Reassess residual risk. After controls are applied, re-score the risk to reflect its reduced likelihood or impact. This residual score shows whether the control is actually working or whether more mitigation is needed.
6. Review and update regularly. Revisit the matrix on a set cadence (monthly, quarterly, or after major incidents) so it reflects current conditions rather than a snapshot from months ago.
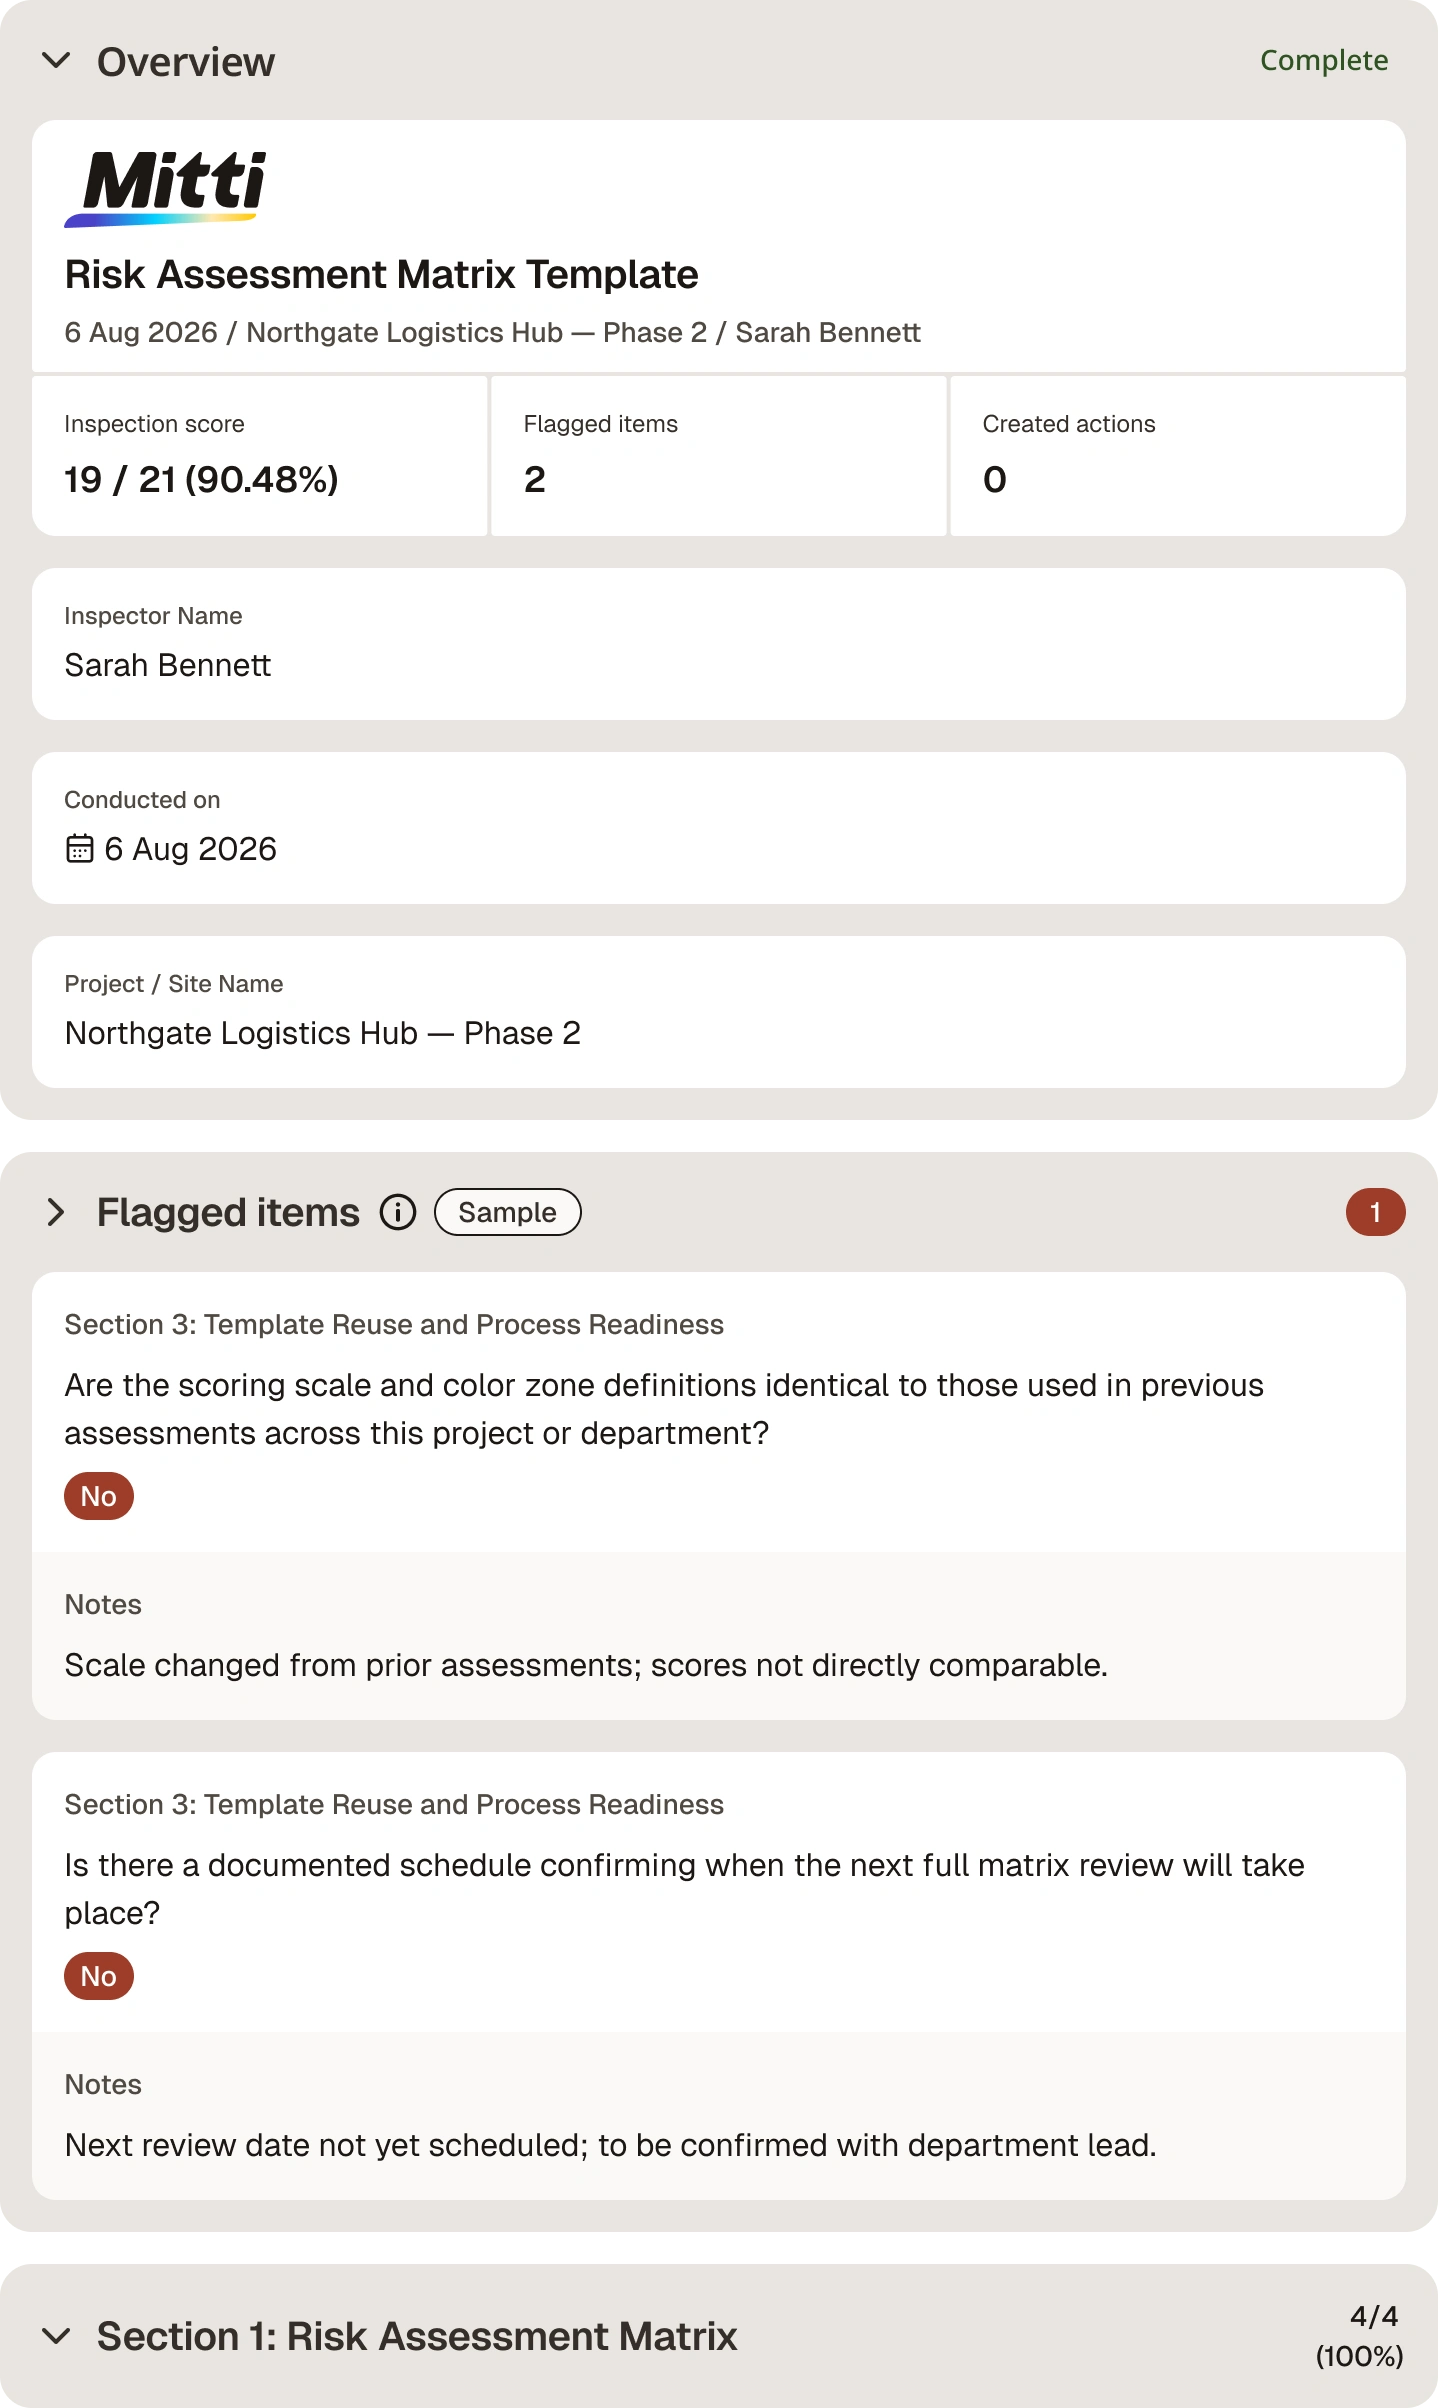
For reference, here is a filled-out risk management matrix template to help you better understand how it works:


Still looking for a checklist?
Search, filter, and customize 60,000+ templates across industries and use cases.